


Clay Holmes’ Evolution in Pinstripes
How the Yankees got the most out of the game's premier groundball arm

Anyone who has followed baseball recently is familiar with Clay Holmes. After three horrendous seasons in Pittsburgh, he’s become a top reliever after a mid-year move to the Bronx for pennies on the dollar. Holmes pitched his way to a 1.37 ERA and 0.814 WHIP by the midpoint of 2022 and looked poised to continue his dominance throughout the rest of the year. What adjustments did the Yankees make to him to make him soar to such heights, and what caused his sudden complete meltdown in command mid-season on the road to a horrific July and August?
Background
Clay Holmes was a no-name player before his trade to the Yankees, and for good reason. In his 2.5-year stint in Pittsburgh, he put together an appalling 5.57 ERA and 1.64 WHIP on Pirates teams that were never going anywhere. He had clear command issues as well, with a 15% walk rate and an xFIP near 5. However, 2021 provides fans with a level of optimism. On the day he was traded to the Yankees, he had a 3.7 xFIP and 3.59 SIERA (ERA using at bat outcomes rather than runs), partly due to his elite 70.3 GB%, a rate that was third in the majors with at least his number of innings pitched. Only Emmanuel Clase and Framber Valdez, two players certainly not for sale at the deadline, were better, and his hard-hit rate was 6th-lowest for good measure. Holmes’ M.O. was creating weak contact on the ground, something the Yankees would later tap into further.
Given the track record, it seems like a risky proposition at first glance. He had abysmal numbers for 2.5 years, so can a stretch of 42 innings with solid underlying metrics really be enough to overcome that? In this case, yes. Generally, advanced stats like SIERA and xFIP and concrete stats like ground ball rate are better in small samples at capturing a pitcher’s ability than more general ones like WHIP or ERA. In addition, he made serious changes to his arsenal during the 2021 season. He gained 1.5 mph on his sinker, hitting 96 mph, and had a seriously improved slider at 88 mph as a byproduct. Strangely, he also lost the mirrored spin (pitches that spin in perfectly opposite directions and, therefore, look the same out of the hand, have mirrored spin) that he used to have with the two pitches. Still, he maintained a strong tunnel that appeared to be a significant factor in keeping hitters off balance with a limited pitch mix.
What some people may not know about Holmes is that he also threw a curveball with the Pirates. It was used 12% of the time and found decent success with spin that was actually still mirrored with the sinker and had its own unique speed range, sitting at an average of 83 mph. It was clearly his worst pitch, though, and with the success of his two other pitches - ground balls from the sinker and whiffs from the slider - it mainly was extraneous. With the Yankees, he only threw it 7 times during the rest of the 2021 season and ultimately dropped it before 2022.
The Changes
Pitch data is the king of pitching evaluation; there are few things more indicative of a pitcher's ability than the metrics that quantify how the ball flies through the air after it is pitched. One can use pitch data to evaluate simple things like their velocity and break, but also more complex things like their spin efficiency (percent of spin that affects the ball's break) and Approach Angle (the angle at which the ball crosses home plate). Unless one is pitching in a unique environment, such as in Colorado with its thin air, the only thing that impacts these metrics is the pitcher. Therefore, one can use the differences in these metrics before and after a significant change in scenery, such as Holmes' move to New York, to see precisely what was done to his arsenal.
I'll start by looking at his sinker, his primary and most noteworthy pitch. After already possessing a sinker with 5 more inches of vertical movement than the average, according to BaseballSavant, the Yankees made it even better by adding an inch of vertical movement and half an inch of horizontal movement. As a result, no sinker at his average velocity of 96.9 mph moves nearly as much, and no sinker thrown more than 200 times had as low of a pCRA (think SIERA but using computer models rather than a complicated equation) to start the year. That could be too arbitrary of a cut-off. Still, he should only be compared to pitchers who have sinkers as one of their more favored pitches, and 200 times seems like a reasonable target -- Holmes had thrown it more than 400 times at the midpoint of the season himself. The sinker had fallen from .276 to .202 in xWOBA (a measure of quality of contact on the scale of on-base percentage) and from 3.84 to 2.91 in pCRA after one calendar year in New York as a direct result.
His slider is the crucial revelation on the pitch data front, however. After staying constant throughout 2021, its change into a sweeper added 6 inches of horizontal movement, which takes advantage of the sinker, which moves gracefully in the opposite direction at an above-average rate. This emphasis on greater horizontal break on sliders is part of a recent innovation in MLB, where pitchers focus primarily on maximizing break in one direction. Surprisingly, he has above-average vertical break on the sweeper as well, but the movement into LHB is the focus. As a result, the xWOBA on the pitch had been slashed in half in the previous two years, from .366 to .171, with a much lower pCRA as well, falling from 1.66 to 0.28, while admittedly losing 10% in usage rate as well. Only two pitchers (Liam Hendriks and Edwin Diaz) have lower pCRAs on their sliders with at least as many times used. Both pitchers have also benefited from higher spin rates than ever, particularly from more efficient spin rates and a slight gain in sinker velocity. The resulting increase in speed differential from 8 to 11 mph is optimal for such a devastating amount of break, according to this Fangraphs article.
The Yankees elected to move Holmes from 2.5 inches of HMov/8 mph difference to 12 inches/12 mph in the 2022 offseason. While the run value may be lower on average, the move fits perfectly with his sinker and has 4 more inches of break than is accounted for here in the final column. A negative run value for pitchers is better.
The second puzzle piece is "obvious" but surprisingly underutilized. Given Holmes had the nastiest sinker in the game (literally, by being 1st in xWOBA (expected quality of contact on OBP scale) and Run Value (RV), and 3rd in RV/100 pitches, min. 50 PA), and a top sweeper, which was 12th in xWOBA (minimum 25 PA, he has only thrown it 100 times total), why throw anything else? He dropped the curve entirely by 2022 and spiked his sinker use considerably. Instead of a 59% sinker, 28% slider, and 13% curveball split, it is now 82% sinker and 18% slider, with a slight mechanical change to create perfect mirrored-spin pitch tunneling -- one can see the "mirrored" effect on the 2022 graph. He has a pretty normal mix against righties, but against lefties, he throws 93% sinkers, which is especially interesting because before 2022, Holmes said he was looking into a sweeper slider for lefties specifically. The few times it was used, it had a 36.4% CSW and 45% whiff rate, which are both elite. Perhaps it’ll be turned to more against lefties going forward into 2023. Nevertheless, the improvement in results was immediate in 2021 (1.61 ERA with the Yankees), but these stats with the new repertoire portray complete dominance in the first half of 2022.

The orange of Holmes' sinker and the yellow of his slider (sweeper) are perfectly opposite each other on the metaphorical clock on the left, which indicates spin direction. The right is the direction of the break of the pitch itself, again to opposite, albeit in a slightly different place with Holmes' healthy dose of seam-shifted wake. No, I can't explain what that is right now. [BaseballSavant]
Example of pitch tunneling by PlayoffTanaka
So, why has Clay Holmes improved so much with New York? The answer is complicated, but not as much as one may think. He threw his best pitch way more, his second-best pitch far less (with an extremely altered pitch design), dropped his third-best pitch, which was made redundant by the prior changes, and made the pitches’ spin much harder to decipher. He embraced his strengths and with a smidge of assistance from the, had become arguably a top 5 reliever in baseball. Some selected stats he excelled in up until midway through July:
2nd in xSLG (.180)
2nd in xWOBA (.178)
1st in average launch angle (-10.8, and over 7 degrees ahead of Framber Valdez)
1st in ground ball rate (84.3%, 16% ahead)
1st in HRs allowed (0)
2nd in SIERA (0.94)
Tied for 2nd in barrel rate (0.7%)
Not a bad list. Nothing can go wrong, right?
The Slump
On June 19th, Clay Holmes was on top of the world. He had a 0.28 ERA in 32 innings with no blown saves and a stellar 33:3 K:BB ratio. The Yankees had pulled the perfect levers to make him an unstoppable force in the late innings. Then, things started to fall apart. The next day, he blew his first save of the season against the Rays on a Francisco Mejia double and Manuel Margot single. In his subsequent thirteen appearances, he started to show signs of weakness; he was credited with 14 strikeouts and 10 walks and hit by pitches in just 12 innings.
His appearance against the Reds on July 12th can be marked as the start of his slump. He loaded the bases quickly before hitting Kyle Farmer on 2-0, removing him after just 4 batters. He threw 16 pitches - only 5 were strikes - and his earned run total on the year tripled from 2 to 6 by the end of the night. He appeared to recover for the next two weeks, but it was simply a final respite before his true slump. On July 31st against the Royals, he gave up a non-competitive walk, hit by pitch, and three-run bomb by Salvador Perez in sequence. From that game until the end of the year, he would have a 5.71 ERA, 4.61 FIP, 17:8 K:BB ratio with 4 HBP in 18⅔ innings. What happened to the one who seemed like one of the best contact managers in the league?
Obviously, his command faltered. His walk rate jumped from 6.7% to 9.8%, and his HBP rate more than doubled as well. He experienced a 13% drop in O-Swing rate, to a second-lowest in the league at 23.9%, and a decline in swing rate by 5.3%, two critical metrics for a ground ball-oriented pitcher. A drop in strike rate from 67% to 60% certainly didn't help his cause either. His struggles appear to be from a lack of chases on anything outside the zone. This can mean one of two things: a tunneling issue (hitters could identify a pitch, likely the sweeper, out of the hand, and so wouldn't swing) or a release point issue (pitches were completely non-competitive and so nobody would swing either way). Of course, it can be both, and they relate to each other to some extent. Let's investigate.
Potential Problems
I'll investigate using Alex Chamberlain's pitch leaderboard, which gives in-depth pitch data on all pitchers in MLB, with the caveat that it only includes up to September 4th. There are still things that can be deduced, though. For this analysis, the slump begins on July 31st and goes until September 4th. While some may consider it to have started against the Reds, all relievers are prone to horrifically bad outings as an outlier. Holmes' consistent struggles are the interest here.
We can take the loss of mirrored spin out of the equation, as he still managed a perfect 6-hour difference in both periods with the same amount of seam-shifted wake (put simply: break unaccounted for by the spin out of the hand. Still can't talk about it anymore here.). His velocities are the same, and his spin rates and efficiencies are also. However, the amount of break on his pitches and release points on the horizontal plane did change. Could that subtle change in release point be affecting him somehow?
Well, in any case, it hurt his slider. While his sinker maintained a swing rate of around 45%, his slider's dove from 56% to 33%. The slider had a 50% K rate and 0% BB rate in those first four months and had a stellar 0.11 pCRA, despite being thrown in the waste area (the farthest area one could possibly try to throw their pitches off the plate) a staggering 23.9% of the time! In that walk-filled span, he only threw sliders there 8.7%, despite a slash in K rate on the pitch from 50% to 25%. To sum up: he had almost half as many sliders go as strikes and strikeouts, despite no longer throwing them off the plate at anywhere near the same rate. Hitters are picking up on something.
We can also check his release point graph to be sure. The left is before July 30th, and the right is after; the x-axis is the horizontal release point, while the y-axis is vertical. A cursory look at the plot indicates more deviation in the horizontal release point for Holmes, which is substantiated by the data itself: a rise in standard deviation from .137 to .167, albeit with an interesting decline in vertical deviation from .134 to .117. The same trends can be observed in both pitches individually. There appears to be a general mechanical issue that causes his horizontal release point to vary more. In terms of his command, the varied release point could create a problem with his tunneling and make it too apparent when the pitch is a slider out of the hand.


It does appear that there is more horizontal release variation and less vertical. Still, it's hard to determine how much it truly matters pitcher to pitcher - Edwin Diaz had virtually the same amount of deviation in release point in his dominant 2022 season as Holmes did during his slump. There was no discernable difference between his sinker and slider releases.
In the first period, the sinker had an 82.1% weak contact rate and an average -13.1 degree launch angle with a 24-degree standard deviation. That outstanding combination made for just ONE barrel (respect Mitch Garver) allowed in that time. In that second half, with the same sinker? 5% barrel, 55% weak contact rate, and a far worse (but still solid!) 2.6-degree launch angle. Its line-drive rate also increased fourfold to 28%, and the ground ball rate was cut in half to 40%. Given the sinker's job is to generate ground balls, that's not a good development.
Is this a tiny sample? Yes. Holmes had just 22 BBE in the second time frame. To be fair, though, part of that is the hesitancy for the Yankees to put him in for any leveraged situations. July and August were his two lowest-use months, and he didn't even have a single problem for nearly half of July!
Despite the sample size, the struggles over the two months can be sufficiently explained by these primary factors, along with perhaps the most apparent one, simple regression. While Holmes played at an elite level until July 12th, he had a .232 BABIP (typical range is .270-.330) and 90.6% left on-base rate (typically 75-80%), both of which were certain to regress eventually. Of course, his groundball focus keeps his BABIP low and creates double plays for baserunners. Despite that, nobody expected him to have less than one barrel allowed per 100 batters faced for long periods or a sub-2 ERA without elite strikeout pitches. Holmes compounded all of his problems at the worst time: the humid offensive paradise of summer.

As the weather gets warmer, offenses get hotter.
A Better September
In September, which is unfortunately beyond the reach of Chamberlain's pitch leaderboard, the cooler weather helped bring Holmes back to standard form. His strike rate returned to a solid 64% - it was a miserable 60% in the slump - and his ERA was 3.55 with a 3.57 FIP. He turned to his slider 32% of the time, which, while improving his stats overall, created soft contact only 16% of the time and ground balls 58% of the time.
He threw six shutout innings in October with a solid 69% GB rate, albeit with the same problematic walk/HBP rate (13%) and strike rate (62%). I suspect issues remain with the slider, dragging down his strike rate in the process, but a better-tunneled sinker with new confidence kept his groundball rate high enough to lead the league. It was only six innings, though, so it's hard to glean too much from it.
I'm not confident Holmes was entirely back to form with those numbers, but it's a sign of confidence in his slider, which was the pitch that was his main issue. Remember, he completely changed his slider's design pre-2022 and never tried to create soft contact anywhere near the rate of the sinker; it was the whiff pitch. It may be more of a sign of confidence than it looks.
Conclusion
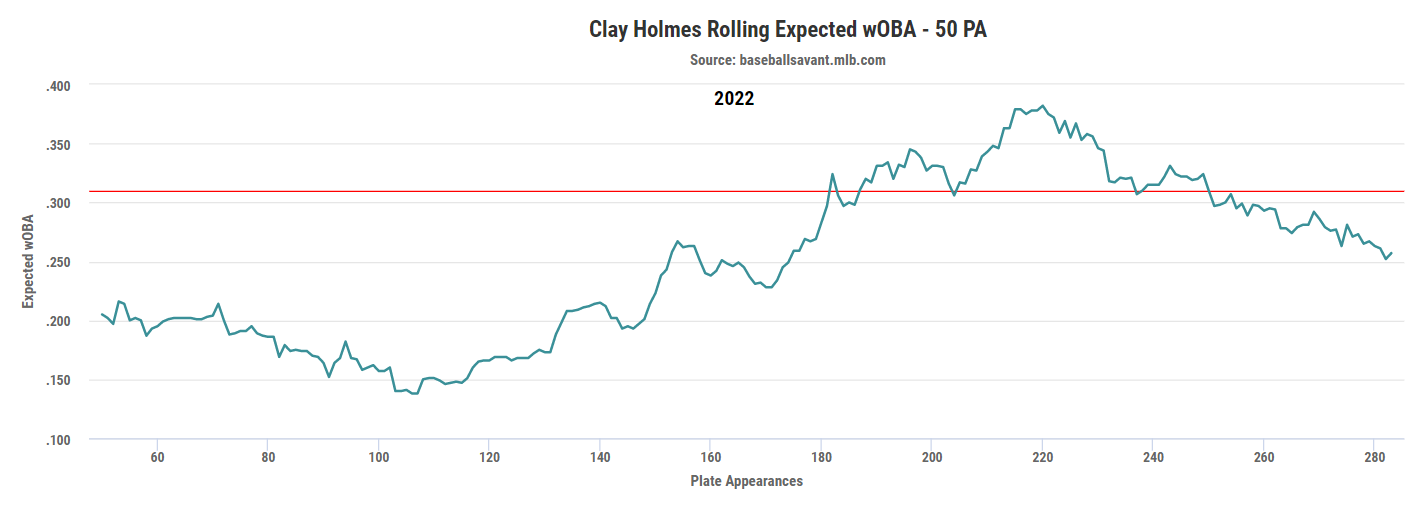
Holmes’ season summed up in a single graph - Dominance, slump, slight resurgence. The significant spike after the 140 Plate Appearance marker is the July 12th Reds game. The last spike right after the 200 PA mark is the Sep 4th game.
From a bird's eye view, Clay Holmes looked like he had a good season - 2.54 ERA, 2.84 FIP, 1.02 WHIP, with a strikeout per inning, is an excellent season. People often value the 2nd half more than the 1st - rightfully so - but sometimes, people look far too deeply into these arbitrary benchmarks. Remember when Jack Flaherty had a 0.91 ERA in the 2nd half of 2019 after a poor 4.64 in the first half? In 2020, he had a 4.91 ERA. Hooray for one counter-example! I don't know if there was anything different in Flaherty's 2nd half that inspired his outstanding breakout performance - it was too long ago now. Either way, sometimes people struggle or succeed for reasons that can't really be explained and just naturally come and go in form.
I hope it was a temporary lapse in ability, for Holmes' sake. I would maintain complete confidence in Holmes going into 2023 because of his pitches' strong coordination with one another: his slider remained elite with a 145 Stuff+ (100 is average, >130 is elite) rating, and his sinker carries the same incredible velocity and tunneling. His barrel rate on the year was still 2nd best, at 1.2%, and he only gave up 2 barrels post-July 12th. Holmes's approach allows him to have poor command because as long as he can throw it somewhere near the zone, he can achieve his entire goal. What can Holmes accomplish with the fresh canvas presented by 2023?