
A Retrospective of 2023 Top 50 Lists
11 months ago, I posted my top 50 players for 2023. How did my rankings and approach compare to others who did the same?

Introduction
Before the start of the season, I created a top 50 MLB player ranking. I evaluated players on a prorated basis, putting almost all my emphasis on their skillset and ignoring any supposed injury risk that wasn't clear beyond a reasonable doubt (i.e. Buxton, Stanton, deGrom, Trout). I’m a statistician and baseball analyst, not a doctor, after all; injuries are extremely unpredictable and noisy at best. When I made that top 50 list, I had the intention of returning to it at the end of the year and judging it against other reputable analysts and sites that released their own, akin to how projection systems are graded after the year concludes. Many people believe predicting injury is a useful skill, so does it really matter? How does a list that ignores injury perform using a ranking method that considers it? Do the TV networks and ESPN submit worse rankings on purpose? Let’s find out.
I’ll get into the methodology more in a minute, but there are two key parts to the ranking - your ‘total’ score, and your ‘prorated’ score. Despite my belief that prorated performance is the best way to evaluate a player 95+% of the time, it’s only fair to use both measuring sticks here. Some of the lists I’ve included undoubtedly used a ‘total value’ framework instead, and they should be graded on that curve as well. Based on my hypothesis, it should make minimal difference anyway; a judgment on a player’s health and skill should almost entirely end up as a judgment on skill in the long run.
The rankings I chose to use were ones by prominent creators and sites in the space that I respect for their understanding of the game, and the three major networks that put out their own: CBS, ESPN, and MLB Network. There were others that I saw from random people on Instagram, but based on their lists I don't think they’d want to be included anyway. The truth hurts.
Lastly, as a statistics student I feel obligated to say that a sample size of one year, with only 50 evaluations for that year, is much less indicative of actual prediction abilities than I would hope, especially when a lot of the rankings are nearly identical to one another. My analysis here definitely shouldn’t be considered definitive research into the topic. I just like Excel and wasting my time!
The sheet that I used for the data, with some guidance on how to use it, will be available for download at the end as well.
The Rankers
Myself, obviously. You can find my two top 50 player articles for the 2023 season here and here.
FoolishBaseball - The most well-known analytical baseball YouTuber, and the inspiration for my own top 50. I would favor him to be #1 of all contenders (other than me, of course), by a wide margin, because it’s clear he puts a lot of thought into his lists, understands the game at a deep level, and he regularly reviews his work at year’s end. Man, what a great idea!
GiraffeNeckMarc - An extremely popular MLB YouTuber that does a dozen player rankings every year around Christmas time. He always has his top 50 list as the very last one, so the luxury of time certainly needs to be accounted for. I spent three to four months on and off making, and then writing, the article for my 2023 list, for reference.
MLBNerds - A fellow New Yorker who is perhaps the most well-known analytical Twitter/IG account, as well as the least-liked. While I don't agree with some of the stuff he says, I enjoy his general methodological consistency and unique perspective on the game.
r/baseball - The baseball subreddit. Consider it the “wisdom of the crowd” entrant to proceedings, with 30 representatives submitting their ranking before being averaged together for the “subreddit’s” submission. Their criteria was notably different from their emphasis on expected on-field performance, and is not meant to be prorated based on missed time. As a result, they exclude Harper from their top 50, among other small deviations.
MLB Network - The official MLB Network ranking, revealed at a snail’s pace live on the telly. Nobody seems to know who the listmakers behind the curtain are, and their lists are often the most controversial. If any list was made just to drive controversy, I think it’s this one.
CBS/ESPN - Similar in prestige to MLB Network, but at least they release their lists all at once? The general methodology, and the people voting on the list, can be just as murky.
PitcherList - A baseball site with a focus on fantasy baseball. I was surprised to see them make a list, frankly. Unlike the ESPN and CBS lists, it seems like a more modest ranking by two individuals on the staff.
Consensus - My aggregation of all nine lists’ ranking of each player, with the highest and lowest ranking removed. My love for players like Fernando Tatis Jr. and Shane McClanahan, therefore, will be washed away in its aggregated rank.
Methodology
In total, I tried four methods to rank the 9 lists, looking both at total WAR and prorated WAR. In each case, the score someone gets for a player is the difference between their ranking of the player and the overall ranking of the player on the final season leaderboard, with hitters and pitchers included. In all cases, I also looked at the absolute value of the difference, which is far less punishing when off by a large margin, which ends up happening in several cases.
The most basic methods, dubbed Total and Prorated, are as described. Each ranked player’s final WAR rank, which is the “raw” value in the former case and prorated in the latter, is subtracted from the rank given by the ranker, squared. For prorated stats, I used WAR per 650 PA for hitters and WAR per 180 IP for pitchers, and divided the sum by the number of players that qualified out of the 50 on each list. I played around with the proration values a little bit, but it’s only going to slightly affect how the hitters’ and pitchers’ performances are weighted against one another.
I also included separate Common Player and Different Player rankings for Total and Prorated. The Common category gives the lists a score based on players that were unanimous in the top 50 amongst the 9 rankers, and the Different category rates the ranking of the other 19 players on each list. In total, 31 players were on all lists, and 39 different players made up the remaining 19 slots. While I don't think it’s a useful measure to evaluate someone’s evaluation abilities, it’s an interesting way to determine where someone’s best results came from - was it ranking the consensus best players better than everyone else or finding the hidden gems some people didn’t?
Throughout the course of my analysis here, I’ll be using the 650 PA/180 IP proration, with fWAR for offense and rWAR for pitching, and a 376.5 PA and 121.5 IP qualifier (¾ of the marks to qualify for the AVG and ERA title, respectively). These qualifiers will exclude any players in the proration ranking with a low amount of playing time to avoid an excessive swing in results. The total rankings aren’t affected by the qualifier, because it’s meant to address the “injuries are predictable and should be heavily considered” crowd.
I feel the need to explain my WAR choices to some extent, but I’ll keep it succinct: I use fWAR for hitters because it values framing for catchers, while rWAR does not. I use rWAR for pitchers because it evaluates a pitcher’s true performance given their environment, while fWAR’s reliance on FIP has always been a little too theoretical for me. I haven’t done enough research into WARP, frankly, to understand its positives or negatives relative to other options. All options are included in the sheet.
The Results and Takeaways

The four main categories are highlighted in yellow. The average scores are color-coded at the bottom from green (best) to red (worst).
The results are in! In this case, the averages are only for the prorated and total sections, and don't include common and different player rankings, although the option does exist to include them if you’d like. I thought it created too much double-counting in general.
For the prorated section I came in first, followed by Marc, the Consensus ranking, PitcherList, Foolish, and r/baseball. In the total section, it goes Marc, Consensus, me, Foolish, and PitcherList. I use Z-Scores to rank the lists here (where lower is paradoxically better - you don't want to know how long I deliberated over the polarity of them), instead of by pure ranking. While the pure ranking option can be useful, it doesn’t reflect how much of a gap one list has over another, creating results that are much less nuanced than those presented here. Here’s a graphical representation using the prorated and total averages to illustrate the results even better:
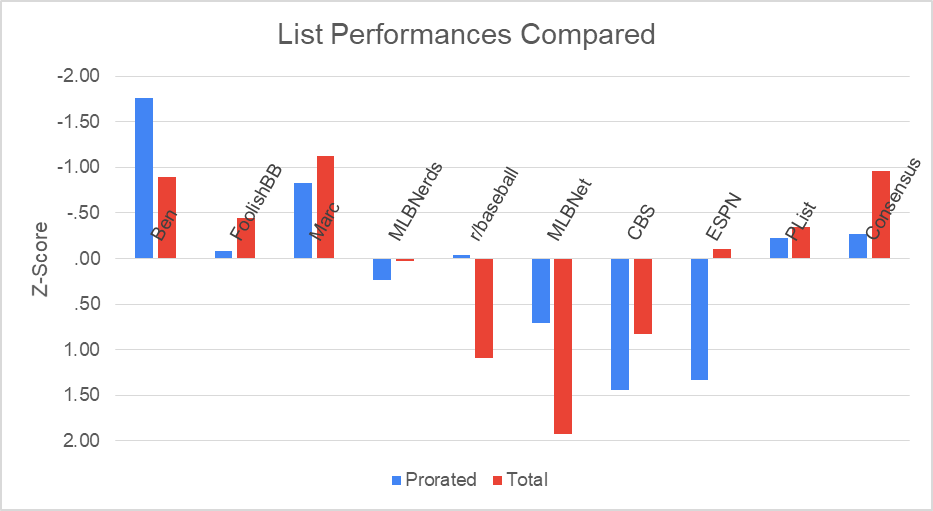
There are a couple critical things to note here. ESPN had the 2nd-worst prorated list, yet an above-average prorated WAR list, thanks to their unique inclusion of Gallen and their dodging of landmines like Woodruff, Manoah, Buxton, and Springer, while having deGrom all the way down at 44th. Comically, every list other than CBS’ was nailed by Rodon’s inclusion, which cost every list involved a 200% increase in their point total, from around 1 million to 3. However, CBS included Manoah in his place, giving them an equally terrible amount of points, and setting everyone square. The exception to this is MLBNetwork, which included Jose Abreu with Manoah. Their score was so bad in both categories that it completely ruined the scale, forcing me to add an ‘exclude Abreu’ option. If he was included, their average Z-Score in both categories would be ~2.75, making them easily last in both categories. Obviously, I made good use of that special feature in the graphics here, and any future ones.
The consensus ranking is notable for finishing 3rd in Prorated, and 2nd in Total. It’s clear that the aggregation, or “wisdom of the crowd” effect is appearing here, to some extent. Most notably, it nearly beats out Marc as the best Total ranking (~0.1 Z-Score difference). Is aggregating evaluation of injury risk actually conducive, or is it just an outlier?

The consensus top 50 rankings
Speaking of the wisdom of the crowd, here’s the opposite. The seven completely unique inclusions on the various rankings were Alejandro Kirk (CBS), Dylan Cease (CBS), Kevin Gausman (CBS), Kyle Schwarber (MLBNet), Jose Abreu (MLBNet), Zac Gallen (ESPN), Gunnar Henderson (MLBNerds), and Tyler Glasnow (MLBNerds). Other than ESPN, who eked over the line on the total score, all of these lists were below average in every section. Of course, MLBNerds is hard done by this, with two scores barely below average, and his unique inclusion of Gunnar Henderson was utterly fantastic, and didn’t contribute to his below-average performance at all. I remember the comment section wasn’t too fond of the pick at the time, but then again, people react the same way to Yamamoto being anywhere in a top 100 list today.
Marc’s performance was the most surprising to me, with an outright victory in the total section, and a 2nd place finish in prorated. He did a spectacular job dodging common pitfalls like Max Fried (represented on 5/9 lists), Shane McClanahan (6/9), and Spencer Strider (4/9) and even ignored his typical Mets bias by excluding Jeff McNeil (4/9). In addition, he was high on Swanson, Robert, and Olson, all of which paid him massive dividends. If you believe judging injury risk is a true skill, then the biggest improvers of CBS and ESPN…did their homework? Every other list either was indifferent to the category, or lost a dramatic amount compared to prorated. Not a great case for the “injuries can be predicted” camp.
Speaking of judging injury risk, it’s clear that consideration of it had minimal effect on predicting actual production.. Despite largely ignoring it by ranking McClanahan, Judge, deGrom, Buxton, and others highly, I still finished 3rd in both the Total and TotalSqd categories, while r/baseball, a crowdsourced list that put heavy emphasis on it, finished 2nd-worst. One could argue, I suppose, that their overall judgment of player skill was worse than average, not necessarily their assessment of the player’s health. I would buy that argument if their rankings even agreed with their overarching methodology: rubber arm Cole at 38th and iron man Semien at 75th, while Bieber is in the top 50 with suspicious shoulder health, and old men Verlander and Scherzer in the top 40? I can only guess that some rankers took some liberties when putting their lists together and when considering injury risk and upside, but even for a list with the utmost emphasis on actual production, it finds it difficult to rank players based on that criteria consistently. That’s enough bashing Reddit’s list (which I only did because of their directly opposite viewpoint to mine, frankly). Twitter does that enough already.
Based on these results, we can’t say anything specific about people’s ranking abilities, of course. But, it’s clear that the TV networks do submit worse lists than they should, to some extent, based on how much worse they were than everyone else. (Especially MLB Network). There are no real cases of any list performing poorly in one area but great in another, but all the lists seem to perform about as well in both sections, implying injuries have little impact. They’re nearly impossible to predict, so nobody is skillfully avoiding them: 7 people included Buxton, 8 had Rodon, and all 9 placed deGrom somewhere! CBS and ESPN did put deGrom at 50 and 44 respectively, which is something I can respect, but most people fell right in. It didn’t seem to do much good for CBS’ performance in the category anyway.
Contrarian Score
I decided to also quickly calculate a ‘contrarian’ score based on how different every list’s rankings on the common players (the 31 shared across all 9 - the top 29 by consensus, Xander Bogaerts, and Will Smith) were to the average of every other list’s ranking of the player:

The sum of the differences between the given ranker’s rank and the consensus’ rank of all 31 players that appeared on every list.
As one may expect, ESPN and CBS are some of the worst offenders, but the oft-controversial MLBNerds finds himself in 1st place, largely due to his valuation of Betts (15th? really?) and Tatis. I placed 4th, primarily from my extremely unique placements of Machado at 23rd, Alcantara at 24th, and Guerrero Jr. at 38th. MLBNetwork is 6th, likely because the controversy comes from their unique choices, rather than their rankings of the household names. That’s a flaw to the methodology for this exercise that I definitely thought about for more than five minutes. Foolish and Marc have by far the lowest, which also happens to be the only two YouTubers here. Does potential criticism from their audience decrease their appetite to go against the grain? With such a wide gap between them and everyone else, I wouldn’t count it out.
Potential Critique
Lastly, before you say “You picked the measures that made you look the best!”, check out the graphic below. I picked the 3rd-best qualifier for myself in terms of Z-score, and I laid out my WAR usage preferences in my original articles. The major dropoff in the 251/80 PA/IP qualifier is largely due to Rodon’s inclusion, who I had 20 spots higher than Mark. I do well in the prorated section of all WAR types, but fWAR-FIP gives me far less credit for guys like Cole and McClanahan, and WARP concurs while adding Gimenez and Woodruff to my personal pain train.

The first table is based on fWAR hitting WAR and rWAR for pitching WAR, and 376.5 PA/121.5 IP for the second chart.
Evaluating My Own List
I’m obviously very happy with my list’s performance, which has the added benefit of making writing this article much easier. My pessimism on Trea Turner, Manny Machado, Sandy Alcantara, and Vlad Guerrero Jr. were all outliers that helped me considerably, which I explained in my original top 50 articles. This article is long enough already. The two pivotal omissions of mine were Jeff McNeil and George Springer, the latter of which had 6 inclusions out of 9. I never considered including Springer, based on his clear continued decline in quality of contact and defense, along with a bad case of old. I looked into McNeil slightly more, but all of his value comes from his defense at 2B and stats that all originate from high BABIPs. Andres Gimenez is cut from a similar cloth, but is significantly younger and is better defensively. Rodon’s injury hurt me considerably, but I didn’t expect him to regress in virtually every way as soon as he returned. He’s not going to make the list next year, but I don't think a fairy turned him into a complete pumpkin. He’ll be fine.
Some of my other omissions annoy me significantly more, for obvious reasons. The biggest by far is Matt Olson, who I barely considered at all. Only four people here had him on their list, but my exclusion of him largely came from an undervaluation of first basemen. The skills he has now were all somewhat present then, and I should have believed in the talent. Other players I considered were Ha-Seong Kim, because I thought his offense would continue to improve with great defense; Framber Valdez, for consistently great pitching; Yandy Diaz, for an improving groundball rate and consistently great plate discipline; and Corbin Carroll, as a high upside rookie to take a chance on.
In terms of my least favorite rankings, I probably gave Correa too much credit for his upside, and I forgot I even put Buxton on my list until a week ago, proving it probably was a bad bet. Seager was probably five spots too low, given the skills and the banning of the shift. Otherwise, I find them to be understandable given when I did them. I’m never going to get it all right. It’s not like anyone else did much better!
Using The Sheet
The sheet is downloadable here. The ‘Ovr’ sheet has all the parameters that can be tinkered with, and you can see the raw ranks of every person involved in the ‘Ranks’ tab. You can replace one of the lists with one of your own if you want to see how it shakes out (the easiest would be Consensus). The ‘Ranking Data’ calculates the adjusted rank used for the consensus ranking, and shows interesting stats like the number of inclusions for each player, and the standard deviation of a given player’s ranking. The ‘WAR’ sheet tabulates all the ranks in the Prorated and Total sections based on the “Ovr” sheet’s parameters.
Conclusion
The main conclusion here is that predicting baseball is really, really hard, even when just choosing parameters. Different WARs are different stats, so one’s results can heavily vary from that alone. But then, should there be a qualifier? If so, what? Is there such a thing as “too bad” of a score for a player, such that it should be capped or removed altogether? It’s an exhaustive game of cat and mouse, but the mouse is just our own satisfaction with the procedure. That was deep.
While we can’t get the perfect approach, with baseball being a game of such high variance, we can reduce the uncertainty with strategic ranking decisions. Excluding playing time questions and injury concerns is a good start. People love to retroactively assign obvious signals of injury or bad play, but 8/9 of lists here said that Rodon would be a top 50 player, and the ninth said Manoah would be instead. Both provided less value for their teams than I did, sitting on my couch. Obviously, injury risk is important, and in a perfect world, would be well understood and predictable. But as the results show, if it’s not extremely obvious, as with someone like Byron Buxton, trying to predict it is a fruitless endeavor.
But based on this analysis, the community seems to get it right. While the margins are narrower than people may think, individuals like Foolish, Marc, MLBNerds, and I consistently outshined the “clickbait” on sites like MLBNetwork and ESPN. The exact order we observe can be chalked up largely to variance, I think.
There’s a lot more I could have gone into, but this article is long enough already. The top of my priority list would be comparing the lists to top projection systems like ATC and The Bat X, to see how us mortals would compare. I don’t think the results would be too flattering, so perhaps it’s for the best.
I’ve seen a lot of top 50 lists popping up over the past few weeks before the 2024 season, so I’m excited to see who else leaps into the ring. It gets me excited and motivated to actually finish work on my list; it’s probably ⅔ done, and I hope to get Ranks #1-#25 out in the next two weeks. But first, I’ll release an article looking back at my work from the past year, and reflecting on it. How much did I end up getting right, and how many times did I evaluate someone as poorly as I did with Brent Rooker? How fun.
P. S. Why did I make the spreadsheet use only the last names, rather than their full names? What. A. Headache.
Sources
FanGraphs leaderboards for fWAR
Stathead for rWAR
BaseballProspectus leaderboards for WARP